The Graph Editor
The Graph Editor is where you build and edit a Yeti node's graph: you create nodes, connect them, and set their parameters.
Opening the Graph Editor
Select a Yeti node, then click GE on the Yeti shelf or choose Yeti > Open Graph Editor. The Graph Editor opens in a floating window. You can also open it in any of Maya's panels: from the panel's menu bar, choose Panels > Yeti > Graph Editor.
The Graph Editor shows the graph of the Yeti node you've selected, and switches when you select a different one. To keep working on the same graph while you select other objects in the scene, turn on View > Lock Current Selection. The Scene Nodes menu lists every Yeti node in the scene, so you can switch between them quickly.
Opening the Graph Editor checks out an interactive license. See How does Yeti use licenses?
The Layout
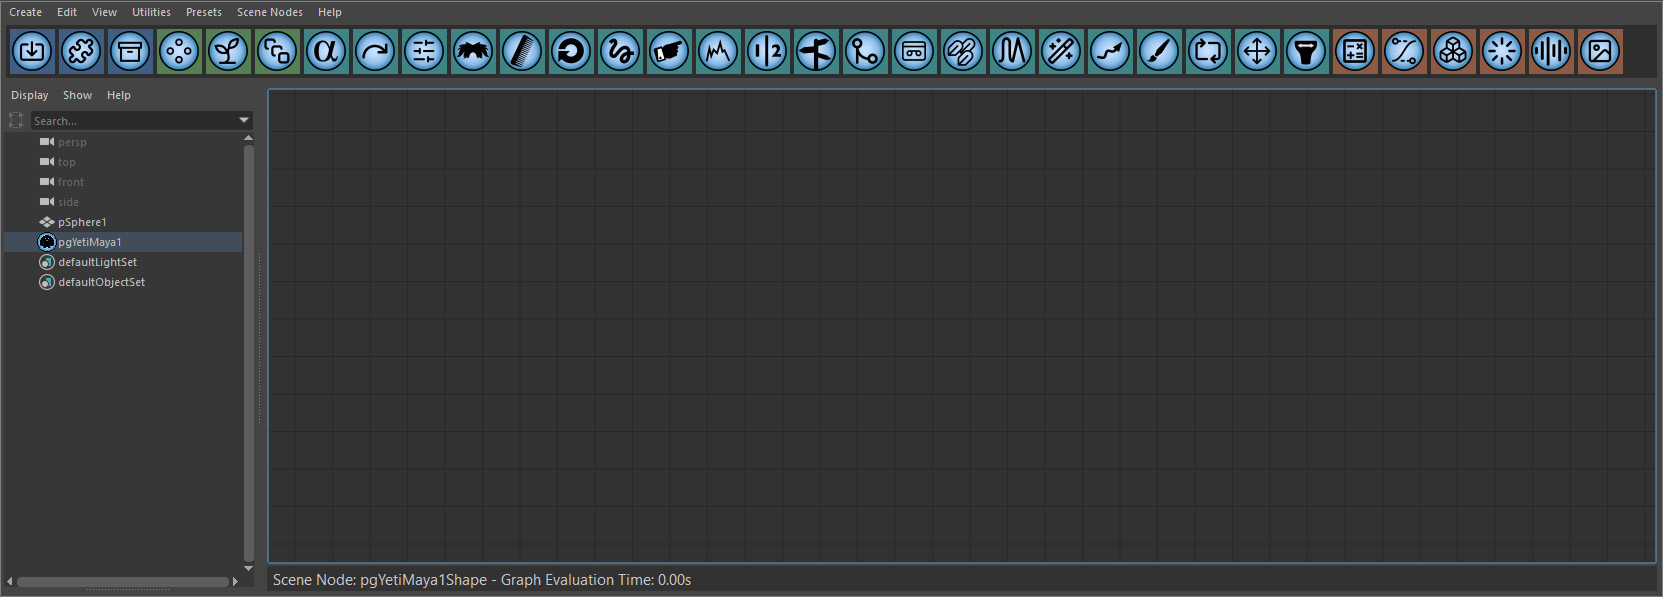
- Menu bar: the Create, Edit, View, Utilities, Presets and Scene Nodes menus.
- Toolbar: a button for each node and sampler. Hold the pointer over a button to see its name. The buttons are coloured by category: nodes that bring data in, nodes that create data, nodes that modify it, and samplers.
- Outliner: on the left, a Maya outliner, so you can select objects in the scene without leaving the Graph Editor.
- Graph: the main area, where you build the graph.
- Status line: along the bottom, the name of the Yeti node you're editing and how long the graph took to evaluate. If the graph has an error, the status line shows it.
Creating Nodes
There are three ways to create a node:
- Click its button on the toolbar.
- Choose it from the Create menu.
- Press Tab with the pointer over the graph, and choose it from the menu that appears. The node is created where the pointer is.
If a node is selected when you create a new node, Yeti connects the new node to the selected node's output for you. To turn this off, clear Create > Auto-Connect Nodes.
To delete nodes, select them and press Delete or Backspace.
Connecting Nodes
A node's inputs are the circles on its left edge, numbered from the top, and its output is the circle on its right edge. Data flows from left to right.
To connect two nodes, drag from one node's output to another node's input. An input can only have one connection, but an output can connect to as many inputs as you like.
To remove a connection, click its arrow to select it, then press Delete.
Samplers connect differently: drag from a sampler's output onto a node, and choose the parameter you want it to control from the menu that appears.
Root and Ignore
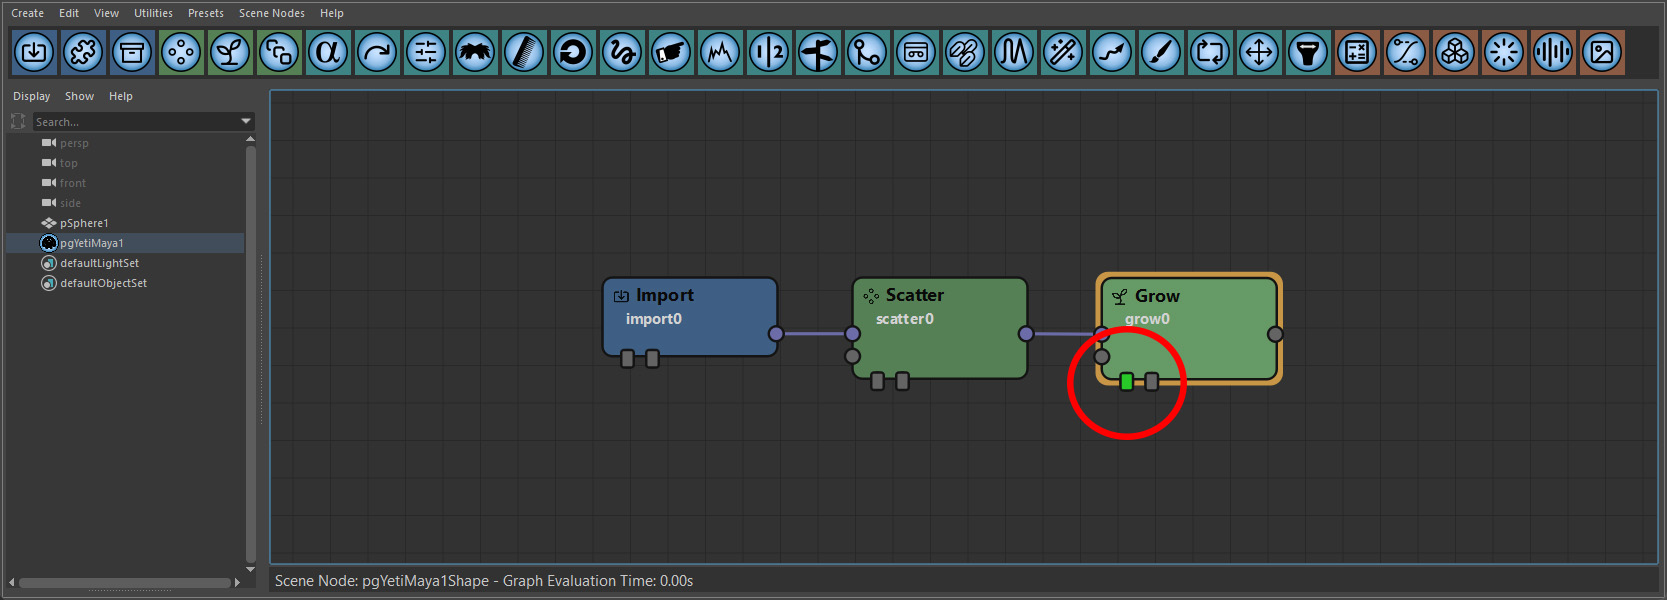
Each node has two small toggles along its bottom edge.
| Toggle | Description |
|---|---|
| Root (left) | Marks the node as the Root of the graph, the node whose result the Yeti node displays and renders. Yeti evaluates the graph up to and including this node, and shows nothing until a Root is set. Move the Root to an earlier node to see the result of each step on its own. It's highlighted in green when it's on. |
| Ignore (right) | Skips the node, so its input passes straight through unchanged. Use this to compare the result with and without the node. If several nodes are selected, clicking Ignore on one of them sets it for all of them. Nodes that create or bring in data, such as Import, Scatter and Grow, can't be ignored. |
Editing Parameters
To edit a node's parameters, double-click the node, or select it and press I. The Inspector opens, showing the node's parameters, with its common parameters on a separate tab. As you change a parameter, the viewport updates.
Each number parameter has a small button to the right of its slider. Click it to switch between the slider and a text field where you can type an expression. The button is green while the parameter uses the text field.
When a sampler controls a parameter, the Inspector shows the sampler's name next to it, and the small button to the left of the parameter is highlighted. To disconnect the sampler, click that button and choose Disconnect.
If a parameter has an error, for example an expression that isn't valid, its field is outlined in red.
Moving Around the Graph
| To | Do this |
|---|---|
| Pan | Drag with the middle mouse button, or Alt+drag with the left mouse button. |
| Zoom | Scroll the mouse wheel, or Alt+drag with the right mouse button. |
| Frame the whole graph | Press A. |
| Frame the selected nodes | Press F. |
| Select several nodes | Drag a box around them. |
| Find a node | Press Ctrl+F and type its name. |
Keeping a Graph Organized
As a graph grows, these tools help keep it readable:
- Groups: select some nodes and press Ctrl+G to put them in a group, which you can name, move and collapse as one. Press Ctrl+Shift+G to ungroup them. Right-click a group to select everything in it.
- Notes: choose Create > Create Note to add a note to the graph, for example to explain what a part of the graph does. Double-click a note to edit it.
- Auto-Layout: choose Edit > Auto-Layout to tidy the layout of the selected nodes.
- Colours: choose Utilities > Set Color to give the selected nodes your own colour, and Reset Color to go back to the default. To make a colour the default for a type of node, colour a node of that type, then choose Utilities > Default Colors > Save Default Colors For Selected.
Nodes can also be cut, copied and pasted (Ctrl+X, Ctrl+C and Ctrl+V), including between the graphs of different Yeti nodes. Ctrl+Z and Ctrl+Shift+Z undo and redo changes to the graph.
Presets
A preset is a set of nodes that you've saved to reuse in other graphs, such as a favourite clumping setup.
To save one, select the nodes and choose Presets > Save Selection As Preset. Your presets appear in the Presets > Local menu, and presets shared by your studio appear in Presets > Global. Choose a preset to add its nodes to the graph.
Open Local Preset Folder opens the folder your presets are saved in, and Refresh Presets updates the menus after you've added or changed preset files. See Configuration Files to share presets with your team.
Finding Slow Nodes and Errors
If a node has an error, it's drawn in red. Hold the pointer over the node to see the error.
To see how long each node takes to evaluate, choose View > Display Heatmap. Nodes are coloured from blue-green for the fastest to orange for the slowest, so you can see where the graph spends its time.
Right-click a node for more about its last evaluation: how long it took, how much memory it used, how many objects, fibres and other items it output, and the attributes and variables available on its output. This is a good way to check what a node is producing.